Predicted Global Warming
Without dramatic emissions reductions, global average temperatures could be 2.5°C higher than pre-industrial levels by 2050.
Data
KNMI Climate Change Atlas: GCM CMIP5 1
| RCP 2.6 | RCP 6.0 | |||||
| RCP 4.5 | RCP 8.5 | |||||
| Mean of values predicted by models | ||||||
| Minimum values predicted by models | ||||||
| Maximum values predicted by models | ||||||
The graph above shows the predicted global temperature increases for four different scenarios of future greenhouse gas levels. The greater the temperature increase the greater the risks to ecosystems and human society. A temperature increase greater than 1.5°C is considered dangerous, and greater than 3.0°C is likely to be catastrophic. Under all the scenarios global temperature increases are likely to reach dangerous levels before 2040.
The data for the graph was derived from the outputs of CMIP5 (Coupled Model Intercomparison Project phase 5) climate models – an ensemble of coupled ocean-atmosphere general circulation models (GCMs), which were used in producing the IPCC Fifth Assessment Report.
Climate models are mathematical simulations of the Earth’s climate system. The models utilise scenarios for future greenhouse gas emissions to generate predictions of future climate change. The scenarios which form the inputs to the models are called Representative Concentration Pathways (RCPs). The RCPs consist of detailed sets of figures for potential future emissions of greenhouse gases, and their resulting atmospheric concentrations, which provide a common baseline for running climate models. Each RCP defines an emissions trajectory which results in a particular level of radiative forcing in 2100.
Emissions Scenarios
The key characteristics of the four RCP scenarios are given in the table below.
| Pathway | Scenario | Radiative forcing | Mean cumulative CO2 emissions 2012 to 2100 | 2100 atmospheric CO2 concentration | 2100 atmospheric GHG concentration |
| RCP 2.6 | Rapid, substantial emissions reductions. | Peaking at 3 Wm-2 declining to 2.6 Wm-2 by 2100. | 990 GtCO2 | 421 ppm | 475 ppm CO2eq |
| RCP 4.5 | Emissions grow then decline significantly. | Stabilising at 4.5 Wm-2 by 2100. | 2860 GtCO2 | 538 ppm | 630 ppm CO2eq |
| RCP 6.0 | Emissions grow then reduce somewhat. | Growing to 6.0 Wm-2 by 2100, and continuing to rise. | 3885 GtCO2 | 670 ppm | 800 ppm CO2eq |
| RCP 8.5 | Emissions continue to grow. | Growing to 8.5 Wm-2 by 2100, and continuing to rise. | 6180 GtCO2 | 936 ppm | 1313 ppm CO2eq |
Data
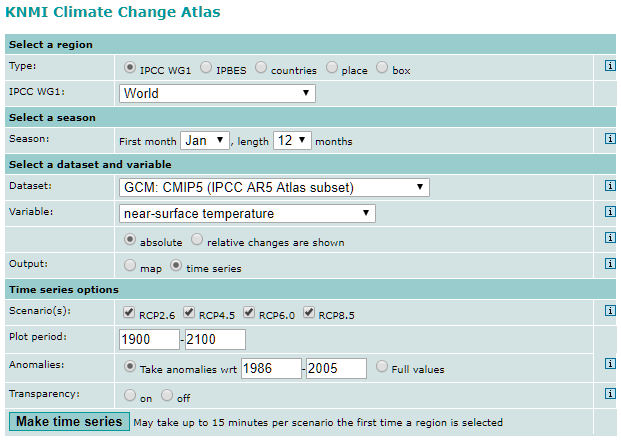
The data for this graph was downloaded from the KNMI Climate Change Atlas. The settings used are shown in the following image:
References
- ‘KNMI Climate Explorer: Climate Change Atlas, GCM: CMIP5 (IPCC AR5 Atlas Subset)’ (KNMI – Royal Netherlands Meteorological Institute) http://climexp.knmi.nl/plot_atlas_form.py?id=someone@somewhere [accessed 8 January 2020] [↩]
Leave a Comment
Can this page be improved? Would you like more explanations of the data and its implications?